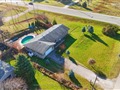
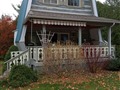
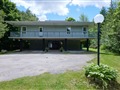
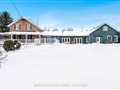
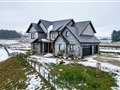
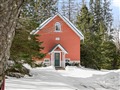
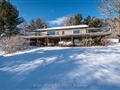
22 Sherman Dr
$876,255
Comparative Market Analysis
Jul 1, 2025
NOT AN ACTIVE LISTING
Historical Performance
| Period | $ Change | % Change |
| 1 Day | +$58 | +0.007% |
| 7 Days | -$529 | -0.060% |
| 30 Days | -$3,082 | -0.350% |
| 3 Months | -$4,397 | -0.499% |
| 6 Months | +$13.5k | +1.56% |
| 1 Year | -$47.1k | -5.10% |
| 3 Years | +$134k | +18.0% |
| 5 Years | +$216k | +32.7% |
| 10 Years | +$416k | +90.5% |
List My Property
Real Estate Statistics
Financing Solutions
Browsing History
6 Sherman Dr, Mulmur
4 seconds ago
AS SEEN ON


Are You a Licensed Real Estate Agent or Broker?